Technical description
How RadBeeper works, for somebody who wants to know: what it reads, what it computes, what every part of the screen is made of, and what it writes to disk.
The front page says what RadBeeper is for and how to start it. This page is what was taken off it to keep it short. Each part has a lab report behind it, listed at the end, with the arithmetic and the measurements.
One port, many readers
Only one program can hold the port — but only one needs to. The process that has it serves what it reads on a socket beside the log, and watch asks that socket before it asks /dev: with the boot service logging, the monitor attaches to it and the port is never touched. Nothing has to be stopped, and the log does not skip a second while you watch. With no service running, the monitor takes the port itself and serves it in turn, so the second window attaches to the first.
No counter yet? tests/fake_gmc.py puts a synthetic counter on a pseudo-terminal — a real Poisson background, because decay is a Poisson process — and exercises the serial path as well as the display: python3 tests/fake_gmc.py --cpm 400, then radbeeper -d /dev/pts/N watch.
The hardware and the kernel
A GQ GMC-320 Plus, plugged into USB. There is no substitute for it in software: RadBeeper reads a real tube over a real serial port, and every number on the screen comes off the wire.
| The counter | A GQ GMC-320 Plus. A GMC-300 works — RadBeeper tries its 57600 baud as well as the 320's 115200 — and a 500 or 600 will be found and read, but its tube is not an M4011, so give it --cpm-per-usvh (see the tube factor). |
| The cable | The USB cable that came with it. It is easy to grab a charge-only cable by mistake: one that carries no data leaves you with nothing plugged in as far as Linux is concerned. |
| The counter, switched on | The USB-serial chip inside is powered by the counter, not by the bus. A 320 that is off, or flat, enumerates as nothing. |
A kernel with ch341 | The 320 Plus presents as a CH340 USB-serial device. linux-lts and linux-rpi carry the driver; Alpine's linux-virt does not. |
Membership of dialout | The serial node is root:dialout and RadBeeper does not want root. |
Plug it in, and Linux should say so:
dmesg | tail -5                       # ch341-uart converter now attached to ttyUSB0
ls -l /dev/ttyUSB*                    # crw-rw---- 1 root dialout ... /dev/ttyUSB0
The kernel is the thing that catches people. These logs were taken from a 320 Plus shared into a VM, and the counter cannot tell the difference — but pass the device through to a guest running linux-virt and it will never appear, however correct the pass-through is:
$ lsusb
Bus 003 Device 002: ID 1a86:7523  USB2.0-Serial      # the counter is right there

$ ls /dev/ttyUSB*
ls: cannot access '/dev/ttyUSB*': No such file or directory
doas apk add linux-lts, reboot into it, and the same device enumerates as /dev/ttyUSB0. This is the trap Copal avoids by installing linux-lts rather than the virt kernel a VM image would otherwise default to.
If /dev/ttyUSB0 still is not there, Troubleshooting names the four things it can be, and they have four different fixes.
Two crates
A static binary off the releases page needs no toolchain at all, which is the point on a Pi. From a clone, make install is cargo install --path ..
The window is a separate crate on purpose — RadBeeper has one dependency and it is libc; Iced brings several hundred, which is the right price for a GPU-accelerated window and the wrong price to put on cargo install radbeeper:
The counter's clock
radbeeper clock says how far the counter's own clock has drifted from this machine's, and --set corrects it. It matters for the backfill: the timestamps in the counter's flash are its own.
The monitor
The monitor is also the logger. Only one program can hold the counter's port, so the log used to have a hole exactly where somebody was watching. Now watch does what the service does, with a screen on top: it reads the counter's history on connect and fills the log's gaps, writes a row every thirty seconds through the same code the service uses, appends every random line, and writes index.html beside the log. --no-log turns all of that off.
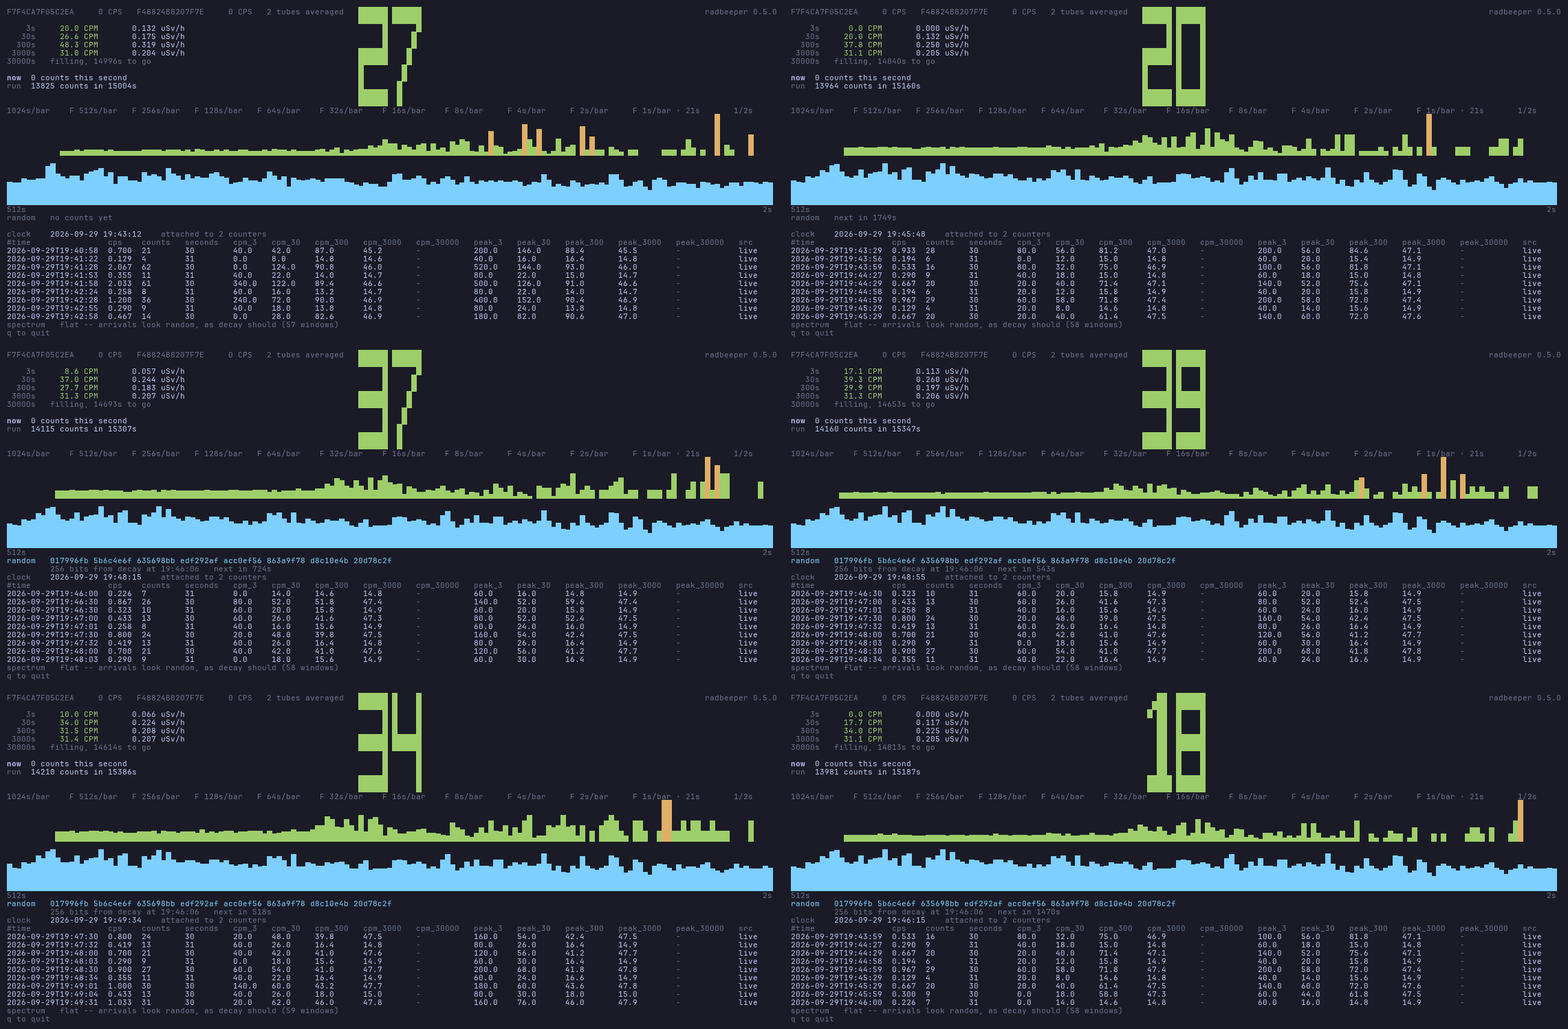
Ten minutes of it, three ways: the first five minutes at a hundred times speed, the hundred seconds after them at ten, and the second the random pool delivered its first line.
| The number, big | The 30-second CPM in block digits. 3 s is too jumpy to read as a headline and 300 s too slow to react to anything you are doing with your hands. |
| Five averages | 3 s to see a source come and go under your hand, 30 s to read the room, 300 s for a number worth writing down, 3000 s for what the background here actually is, and 30000 s — a working day. The counter's own reading is one rolling 60-second count: one number, one time constant, one question answered. |
| The counts, compressing as they age | A second a bar at the right, and each panel to its left holds twice as long in a bar, out to 1024 seconds: eleven panels. Half a day of history in one row of a terminal, at one-second resolution where it matters. In the window a trend line runs over the bars — each bar taken with the four either side of it, weighted by the seconds they cover — because a bar at background is two or three counts and the eye follows the tallest. Point at a bar and a circle marks the trend there, with when the bar was, how long it is, and the trend's and the bar's own rate in CPM. |
| The spectrum | Three windows at once, looking for anything arriving on a schedule. In the window its axis reaches as far as the longest window that has answered: 8m, then 1h 8m, then 9h 6m. Bars are drawn by their logarithm against the loudest in view, so one loud period does not leave the rest a pixel high. The periods over five minutes are a few bins far apart, so the left of the axis is compressed: a tenth of the width for one to nine hours, a seventh for five minutes to an hour. Over it, on the same axis and the full width of it, the window draws the drum spectrogram: a spectrum every eight seconds as a line of its own — the spectrum's own 512-second window for the periods up to eight and a half minutes, joined to its longer windows for the rest — laid up a shaded ground the way a drum recorder lays an earthquake down. The pen is hotter and wider for what is louder — green for the floor, yellow at what luck reaches, red and white over it — each trace is as bright as the room was counting, and a peak has a dot. A period is a coloured streak down the paper. One spike there is noise, and so is a streak under thirty-two rows long. Flat is the good answer — decay is Poisson, and a Poisson process has a flat power spectrum. A peak means something periodic is contaminating the arrivals. |
| The random line | 256 bits of hex out of decay timing, the moment the pool has measured enough min-entropy to justify them. With several tubes each earns its own, from its own counts, and the newest is shown with the letter of the tube that earned it. |
| The log, scrolling | In the terminal, the rows as they go to disk, so what is on screen is what is in the file. |
--line prints one line a second for a pipe instead of drawing a screen.
The window
An instrument cluster: a round dial per counter with a 270-degree sweep on a fixed logarithmic scale, the bands painted on the face at the same thresholds everything else uses, and the reading in digits on the black face under the needle. Beside it the five averaging windows, each with the precision of its own figure. Then the drum spectrogram with the spectrum at its foot, the cascade, the emission and its countdown, and a table of the trend line by tier: where it is now, its average, its high and its low over each panel of the counts, in CPM.
It opens no serial port — it cannot, it has no code for one — which is exactly what makes it safe to open and close all day while the logging carries on underneath.
The two meters
They answer different questions and neither answers the other.
| RAW | A needle per counter, each in that counter's colour. A tube that has wandered off is a needle that has wandered off. This is do they agree? |
| COLLECTED | One needle, carrying three time constants at once. This is what is the room doing? |
They share a scale, because two dials that don't cannot be compared — which is the only reason to draw them side by side.
A dial can show more than one answer at a time and a number cannot. The collected face carries the three seconds its needle points at, the half minute the chrome pointer sits at, and — as two arcs outside the bands — where the needle has been over the last half minute and minute. The gap between needle and pointer is the trend.
The needle has mass: it leans out fast and settles back slower, the way every moving-coil meter does mechanically. Without it the needle teleports once a second and the eye cannot follow which way it went.
The scale does not move
Three decades, 3 → 3000 CPM, and it is the same three every time you look. The range used to be picked from a list to suit the current reading, which meant a value sitting near a boundary flipped the whole face back and forth several times a minute — every band and every tick jumping with it. A fixed scale cannot do that, and a logarithmic one is the right fixed scale here because the quantity is: background is tens of counts a minute, a source is thousands, and on a linear face the only reading anybody ever takes sits in the bottom tenth.
The decades land on the numbers the bands are named after — 3 at the bottom stop, 30 a third of the way round, 300 at two thirds, 3000 at full — with the 2..9 of each decade ticked between them and a heavy mark at every band floor.
The bands, named
A reading is not "above 240" — it is a warning. The names are printed under the cluster in their own colours, and the floor of each is a mark on the face:
| sweep | ||
|---|---|---|
| attenuated — under 3 CPM | 0% | not a clean room: a tube shielded, unplugged or dying |
| nominal — 30 | 33% | ordinary background |
| advisory — 120 | 53% | worth knowing about, not worth acting on |
| warning — 240 | 63% | |
| deadly — 600 | 77% |
The floor of nominal is 30 and not 0, deliberately. Natural background does not go below a few counts a minute, so a counter reading under 30 is reporting itself rather than the room — which is why that band is cold blue and not green, and why the dial's bottom stop is 3 rather than nothing.
Both themes, and it follows yours
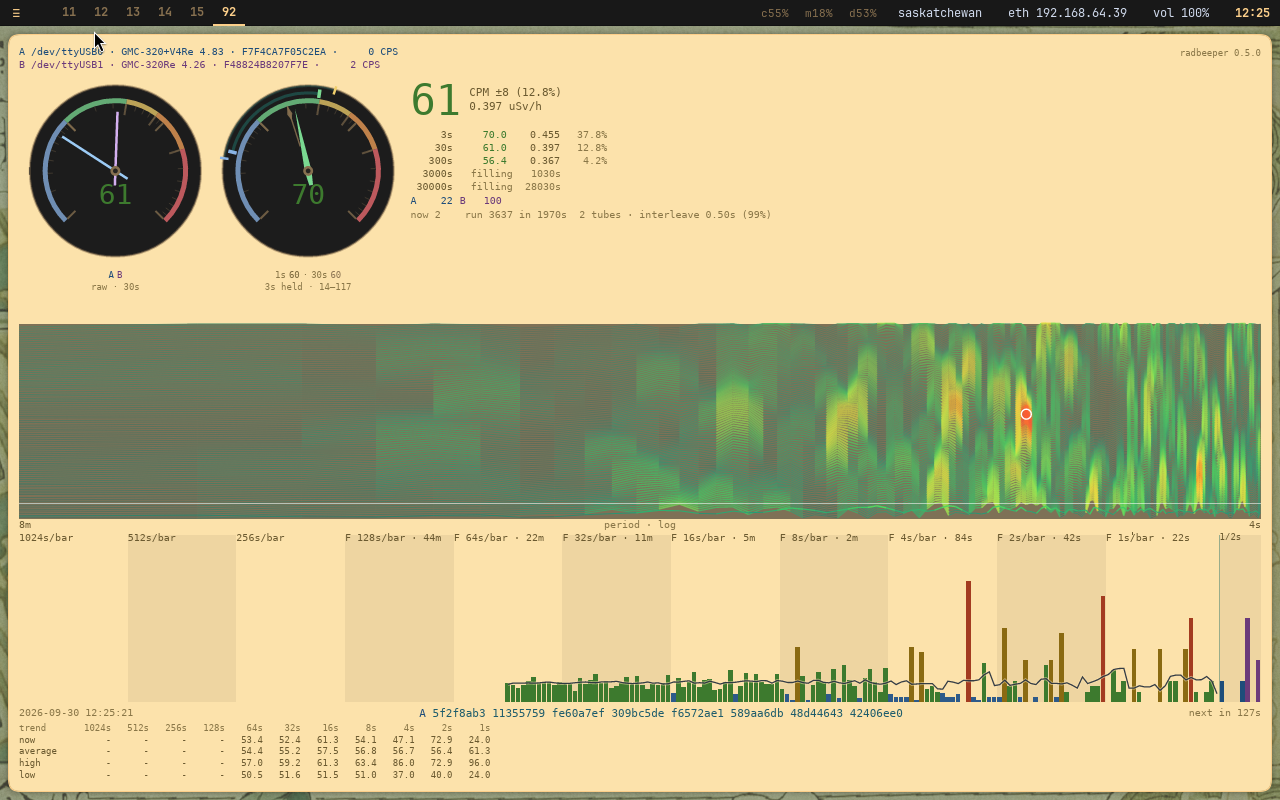
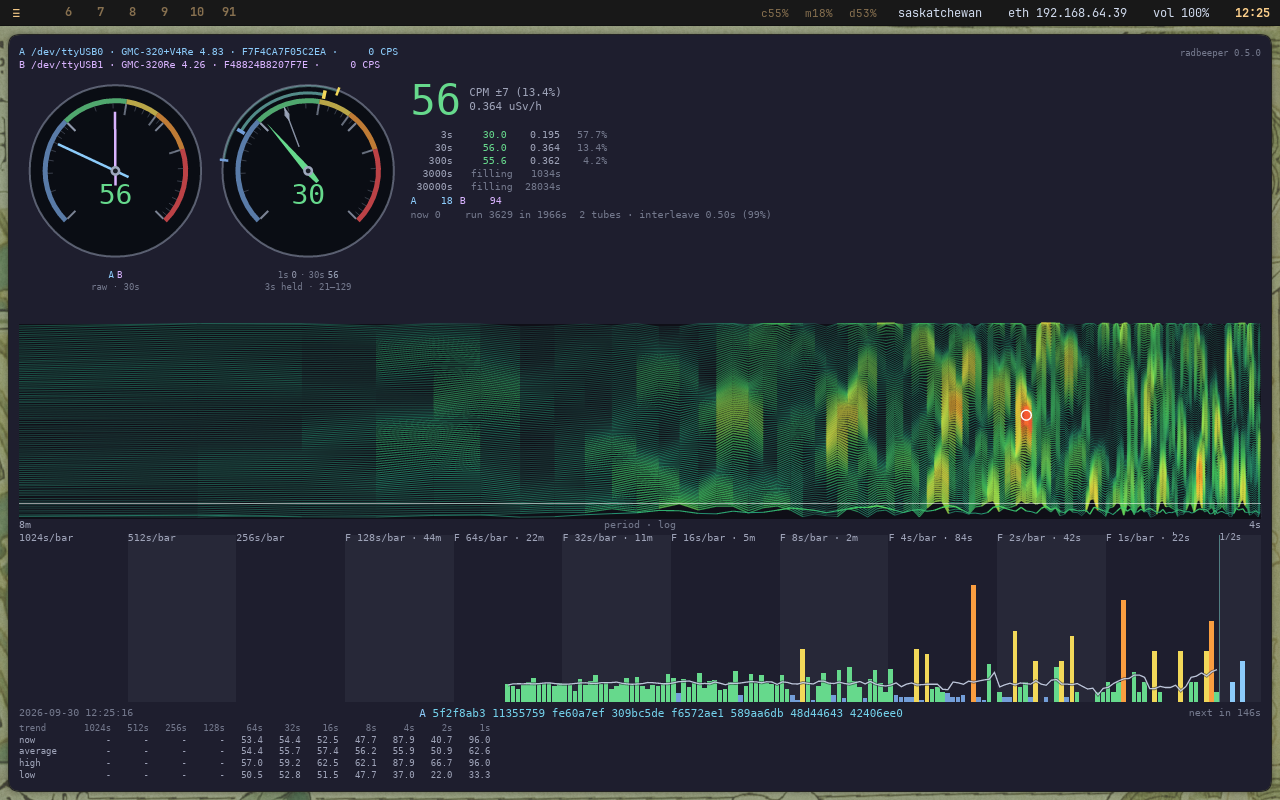
Copal writes down which theme is on, so the window asks rather than guesses. --theme dark, --theme antiquity or --theme auto (the default) override it.
The dial faces stay dark in both. Antiquity's own note about itself is that it is dark chrome around light paper, and a black-faced gauge on paper is what the instruments this borrows from actually look like.
It fits what the compositor gives it
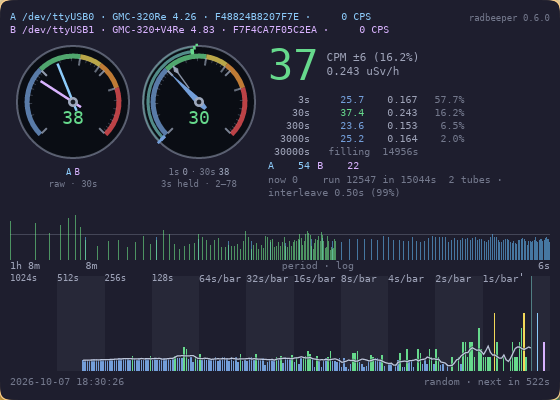
A tiling compositor hands this window whatever is left once every other window has had its share. The charts are the instrument, so they are the last thing to go, not the first: the log table goes first, then the spectrum's axis. The dials, the numbers and the two charts keep their shape all the way down — and grow into the glass when there is more of it.
radbeeper hotplug opens the window when it is installed and a terminal running watch when it is not.
Two counters
Plug in a second GMC and radbeeper service reads both. No flag is needed, and it does not have to be restarted for one: once a log cycle the service looks for a counter that was not there before and adopts it on the spot — its own backfill, its own log, its own entropy pool, and a line on the wire telling every attached window.
Two tubes watching one room are two measurements of one number. They do not double the dose — what doubles is the evidence:
| Each keeps its own log | Separate files, keyed by serial. They are separate instruments and the record has to say which said what; a row that averaged two of them would be a reading neither took. |
| The displays average them | Every combined figure is the mean across the tubes: the same number one tube would report, measured from twice the arrivals. |
| The precision is what improves | Poisson error is 1/sqrt(N), so twice the counts is a factor of root two better. The window prints it: 452 CPM +-21 (4.7%). |
| The cascade grows one more tier | Counters on their own clocks interleave, so the strip ends in a tier of arrival rather than of time — 1/2 of a second with two tubes, 1/9 with nine — drawn in each tube's own colour. |
| And a merged record is kept | cpm-merged-YYYY-MM.tsv, beside the per-counter files: the raw arrivals, the rate of the room, and the interleave. See the log. |
| A tube that stops is left out | The mean is the counts over the tube-seconds that took them, not over the tubes plugged in. A counter whose USB port resets is out of the mean and out of the interleave from the second it goes quiet, and the room reads what it read. |
| And comes back by itself | Once a log cycle the port is asked again, on a thread of its own so nothing waits for a counter that is not answering. It returns to its own slot, its own colour and its own log. |
| Each says what it last counted | The top row names every tube by its serial, and beside it that tube's newest second in counts, CPS — the reading the interleave was given, and with one tube as with several. A number that changes is the data arriving. A tube that is not answering shows nothing, not nought: a nought is a second it listened to. |
The interleave is measured, not assumed. Two counters only sharpen time if they disagree about when a second starts, and neither clock can be steered, so the window reports the offset it actually sees: 2 tubes · interleave 0.50s (100%). Near zero is two tubes firing together — still twice the counts and still the better precision, but no extra resolution in time, and the display says so rather than claiming a half-second bar it has not earned.
The log
One row every 30 seconds into a dated file per counter. watch writes the same rows while it is open, so it does not matter which of the two has the port.
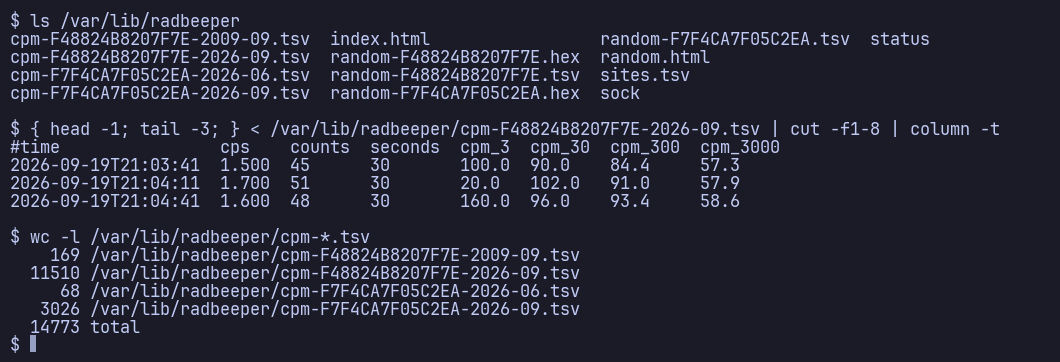
Tabs are invisible and that matters here, because an empty field is not a zero — it is a window that was not full yet. The peaks are the point: a row carrying only the averages as they stood at the instant it was written would miss a source that came and went between two rows, which is the one event actually worth having a log for.
Files rotate by month and by counter (cpm-<serial>-YYYY-MM.tsv), which needs no cron entry and nothing that renames a file while a service is appending to it. State lives in /var/lib/radbeeper when that is writable — not /var/log, because on Alpine desktops that is commonly a tmpfs and every reboot emptied it. A measurement record is state, not a log to rotate away.
The log is the full column-by-column account, including the merged record two or more counters produce, the backfill, and where a counter has been.
Random numbers out of decay
The moment a nucleus decays is not determined by anything, which makes a counter the textbook hardware entropy source.
radbeeper randomb17c9c60 d5deeb7b 4b102dfc bec14efc b523818b 18d3ada0 582bd912 e61ff856
256 bits, min-entropy 258 measured, from 448 seconds at 0.68 counts/s
440 bits is what a Poisson model would have claimed for the same 448 seconds
spectrum flat -- the source looks like decayThat second line is the point: the bits are measured, not modelled, and on this tube the textbook model was measurably wrong — it claimed 1.15 bits a second where the samples support 0.62. A line therefore arrives about half as often as it used to, and the number on it is one the data will support.
The counts behind every line are written beside it, so anyone can recompute it and check it was not invented:
radbeeper random --check  logs/random-F48824B8207F7E-2026-09.tsv   # the emission log
radbeeper random --frames logs/random-F48824B8207F7E-2026-09.bin   # the raw seconds
Every emission also keeps its raw material. The .tsv clamps each second to one hex digit — enough to recompute the key, not enough to say what the tube did — so the seconds are written unclamped to a .bin beside it, one byte each, with the gaps where the counter was away. A four-hundred-second frame is about 450 bytes, and each one recomputes the key written inside it. --no-frames turns it off.
Treat this as a good physical entropy source, not a certified one. It has not been through a statistical test battery, and 256 bits of accounted min-entropy is a claim about the model of the source, not a proof about the output.
Random numbers out of decay is the full account: the three ways this is normally done wrong, the measurement that replaced the model, and what the serial link's one-second resolution costs.
Browsing the raw seconds
Every one of those keys came out of a particular stretch of decay, and that stretch is kept: random-<serial>-YYYY-MM.bin, appended, one byte for an ordinary second.
radbeeper frames list                     # what is on disk, by month
radbeeper frames show --seq 124           # one frame: seconds, spectrum, key, link
radbeeper export --logs logs -o monitor.html --frames-page   # and frames.html
frames.html is the browser: months, then days, then one frame at a time -- as a strip of seconds you can zoom into, or as a spectrum, where flat is the good answer. A frame has its own address, so frames.html#2026-09/124 opens that one.
Getting the data out and back in is frames export and frames import; an imported frame is recomputed from its own counts before it is written and is relinked into this directory's chain rather than carrying somebody else's. Reading the raw record is the full account, including the one thing to know before relying on any of it: only the process holding the serial port writes frames, so a service running an older build records emissions and no frames at all.
Publishing
One self-contained page: summary cards, a log-scale plot of counts per minute by the hour, a by-day table, the latest rows, and — with two or more counters — whether they agree. No JavaScript, no web fonts, no CDN; the chart is SVG the program draws itself. watch writes it by itself after its backfill, every hour and on quit, so a monitor left open keeps it current.
random.html is written beside it whenever there are emissions to account for. It is the one claim on the front page a reader cannot check by looking, so the audit gets its own page.
To put it on the web: fork this repository, copy your cpm-*.tsv, random-*.tsv and sites.tsv into logs/, and push. A GitHub Action rebuilds the site and commits it back, with nothing to install in the workflow — your counter's report lands at /monitor.html, and / is this page, rendered.
make site          # build the whole site locally
make site-serve    # and look at it on http://127.0.0.1:8765/
Running it covers the boot service, one log directory two programs can both write, and publishing in more detail.
Options
Options: --source sim, --sim-cpm, --seed, --spans 3,30,300, --cpm-per-usvh, --log-every, --duration, --clock-offset, --backfill-bytes, --max-gap, --entropy-bits, --device, --baud, --no-log, --no-backfill, --no-export, --no-frames, --entropy-bits, --frames-page, --month, --seq, --json/--tsv/--bin.
The lab reports
The lab reports. Each is the why behind one part of the program — written up properly, with the arithmetic, the failures that shaped it, and the prior art.
| The log | every column, the merged record two counters produce, the backfill, and where a counter has been |
| The stream | why an exclusive lock on a port is not an exclusive claim on the counter; the protocol, what a second tube buys, and the window's layout |
| The cascade strip | chained dyadic time compression: its invariants, its arithmetic, the prior art from RRDtool to exponential histograms, and what to call it |
| The spectrum | why flat is the good answer, how windows are accumulated, and why a peak is not called on sigma alone |
| The drum spectrogram | the trail over the window's spectrum: a row every 8 seconds, joined from the spectrum's three windows, laid up the panel like a seismograph's paper; the thermal pen, the gain that sets its own top, the flow from the port to the pixel, and how long a ridge luck draws |
| Random numbers out of decay | where the bits come from, three ways this is normally done wrong, and why the model was replaced by a measurement |
| Running it | the boot service, one log directory two programs can both write, and publishing without a build step |
| The native build | the Rust crate, what is ported and what is not, and how it is held to the reference implementation |
| Reference | the tube factor, the counter's protocol, what it costs to run, the tests, and how the screenshots are made |
| Troubleshooting | the four things it can be when probe finds nothing, and the four different fixes |
| Prior art | what else reads these counters, and what this does differently |
| Security | what is in scope, what is not, and how the supply chain is kept small |
| A signed chain of custody | the four links from a commit on a Copal VM to a crate on crates.io, the three defects found building them, and what the arrangement does not establish |
| Reading the raw record | the frame browser and the three surfaces under it: what a frame costs measured, months and days out of an append-only file, and the procedure for getting frames in and out |
| The monthly record | how a record that never stops growing is published anyway: dated by construction, chained between months, and identified by a coordinate no finer than you asked for |
| Archive | the long-form README this replaced, kept as it stood at 0.3.1 |