The drum spectrogram
A short-time Fourier transform of a Geiger counter, kept a row at a time and laid up the paper like a seismograph's, by a pen that is hotter and wider for what is louder: what the accumulated spectrum throws away, which is when.
A lab report in the IEEE style, on the trail radbeeper-gui draws over its spectrum. Written against radbeeper 0.5.0, 29 September 2026, and rewritten the same day as the thing it describes was (§X). The technique is described first and named last, in §IX; the short answer is that this document calls it a drum spectrogram, and its pen a thermal pen. Every figure in it was measured on the day, either on the bench's two counters or on simulated counts, and says which.
Abstract
RadBeeper already looks for anything arriving on a schedule, with a power spectrum averaged over every window it has ever taken. Averaging is how a faint period is found and how its time is lost: a line that was present for ten minutes an hour ago and one that has been present all along come out as the same bar. This report describes the view that was added to it. A periodogram of the spectrum's own shortest window, the last 512 seconds, is taken every 8 seconds and kept as a row; to its left each row is carried on, by the spectrum's longer windows, as far as the axis goes. The newest 96 rows are drawn as line traces, one over another, the full width of the panel and on the spectrum's own axis, and the spectrum itself is drawn as the front row of them. The paper holds 12 minutes 40 seconds of rows, made from 21 minutes of counts at periods up to 8 minutes 32 seconds, and from as much as nine hours beyond them. Rows are held against the scatter of the last 3000 seconds, so their heights can be compared and a tube whose counts come in clumps reads flat, and drawn by their logarithm against the loudest thing in view, so one loud period cannot flatten the rest and nothing is ever off the scale. The pen says how loud in its colour, its width and its glow; the whole trace is as bright as the room counted; and a row's peaks are marked. A row on its own is noise by construction. The report gives the arithmetic of a row, the flow from the counter's serial port to the pixel, the measured length of the ridges that chance draws, and what the view can and cannot find.
Index terms -- short-time Fourier transform, spectrogram, ridgeline plot, helicorder, periodogram, Poisson process, automatic gain, colour scale, radiation monitoring.
I. Introduction
A. The problem
Radioactive decay is a Poisson process and the power spectrum of a Poisson process is flat. The spectrum uses that: it averages periodograms, the scatter falls as 1/√N, and anything periodic -- mains hum on a tube's supply, a fan carrying a source past, firmware that batches its reports -- climbs out of a floor that is settling under it.
The average has one number for each period. It cannot say whether the period is there now, whether it came and went, or whether it began when somebody switched something on. Those are the questions asked of a line once it has been seen.
B. What was asked for
A paper-feed plot, of the kind a drum seismograph makes: many traces laid one under another, each a little later than the last, so that something which persists is a shape running down the page. It was to be part of the spectrum it comes from and not a display of its own -- the same axis, the same ground, no frame and no words around it -- with each row five minutes long, later the spectrum's own window (§II.A), coloured by how loud it is, and scaled so that detail is shown whatever is loudest.
II. One row
A row is a periodogram of the last W = 512 seconds of counts per second, summed across the tubes. In order:
| Step | What is done | Why | ||
|---|---|---|---|---|
| 1 | Take the newest 512 seconds, *x*₀ … *x*₅₁₁ | the spectrum's own shortest window, so a row is that window taken once; see §II.A | ||
| 2 | Subtract their mean | the DC term is the count rate, which every other number on the panel gives | ||
| 3 | Multiply by a Hann taper, *w*ᵢ = ½ − ½ cos(2π*i*/511) | a period that does not divide the window would otherwise leak into every bin [2] | ||
| 4 | Transform: X = FFT(x) | analysis::fft, the same one the spectrum uses | ||
| 5 | Take \ | *X*ₖ\ | ² for k = 1 … 255 | bin k is the period 512/k seconds; k = 0 is DC and k = 256 is left out |
| 6 | Divide by v · Σ *w*ᵢ² | v is the scatter of the last 3000 seconds; see §II.B |
A. On the spectrum's own grid
The spectrum accumulates three windows, of 512, 4096 and 32768 seconds. A row is the first of them taken once, and the longer two are what a row is joined from (§II.C). So a join is at a window's own length, the axis is cut where the windows are and nowhere else, and a period the spectrum can see is in the rows at the same place.
For an afternoon a row was 300 seconds, because five minutes is a stretch somebody thinks in; the spectrum's line and the rows' were then cut to different grids, and the axis had a cut at five minutes that was nobody's window. analysis::powers still sums a window of any length as it is written, for a window that is not a power of two; at 512 it is the transform.
B. The normaliser is the scatter of the long window
The first form divided a row by its own mean, which makes every row flat at 1.0 and so makes every row the same height: eight minutes in which the room counted twice as much were drawn no taller than the eight before.
Counts that scatter by chance with a variance of v put v · Σ *w*ᵢ² in every bin, on average, whatever their distribution. So the scatter says what flat should be. Taken over the last 3000 seconds -- the fourth of the panel's five averages -- it says so without being moved much by the window being measured. Against it a row reads 1.0 when the room is as it has been, and the whole of it stands higher when the room is not.
The scatter, not the mean. For counts that arrive one at a time by chance the two are the same number, and the mean was used first. The bench's second tube is not that (§VII.B): its counts come in clumps, with a variance of nearly twice its mean at the best of times, and against the mean every row of it stood hot from one side of the paper to the other with no period in it. Against the scatter a clumped tube reads flat, and what stands up is what arrives on a schedule, which is the question.
The scatter of the change from one second to the next, halved. For counts with no memory that is their variance. The plain variance of fifty minutes with a step in the rate in them is mostly the step, and a row taken after the step read a third of flat; one large change in three thousand is nothing. analysis::scatter_of is the arithmetic, and a test holds it to a Poisson room's variance and to not being swamped by a step.
A test runs a room at 0.9 counts a second beside one counting the same rate two at a time: both read flat at 1.0. Another raises a room from 0.9 to 27 for five minutes: the row stands at about 8, and every bin of it with it.
The price is that a row's level wanders by chance: over 400,000 simulated seconds the mean of a row had a standard deviation of 0.11.
C. A row is joined from several windows
A window holds no period longer than itself, so a row of 512 seconds stops there, and on a panel whose axis ran to an hour the traces had the right-hand three fifths of it and the left was bare. The periods beyond are in the spectrum's longer windows, and analysis::Trail takes a row from all three, every one ending at the same second:
| Window | Bins it gives | Their periods | Steps a row |
|---|---|---|---|
| 512 s | 255, which is all it has | 512 s to 2.008 s | 130,560 |
| 4096 s | 7 | 4096 s to 585 s | 28,672 |
| 32768 s | 7 | 32768 s to 4681 s | 229,376 |
From each window after the first, only the bins that are longer than the window before it could hold. That is 269 bins in a row, and the fourteen on the left are all there is out there: a window has one bin at its own length, one at half of it, one at a third.
Only the bins that are asked for are worked out; and only the rows that are on show. add keeps the second and nothing else, and rows works out what is missing, so a window that is handed hours of history when it attaches works out ninety-six rows at the end and not three thousand on the way.
A window that has not yet its seconds is left out of the row, and the trace begins where there is something to draw.
D. The parameters
| Value | In seconds | |
|---|---|---|
Window, W | 512 samples | 8 m 32 s |
Hop, H | 8 samples | 8 s |
Depth, D | 96 rows | — |
| Bins of the window | 255 | periods of 512 s down to 2.008 s |
| Spacing of the bins | 1/512 Hz | — |
| Bins joined on from longer windows | 14 | 585 s to 32768 s |
| Overlap of a row with the one before | 504 of 512 seconds | 98.4% |
| The normaliser's average | 3000 samples | 50 m |
III. The flow
This is what happens to a count between the tube and the screen. Each box is one place in the code.
 two GMC-320s                     each reports the counts of its last second
      │  serial, once a second
      ▼
 radbeeper service                holds the ports, logs, and serves the stream
      │  unix socket, a line a sample: who, when, counts
      ▼
 feed thread (gui)                one per window; replays what the service
      │                           holds when it attaches
      │  samples are summed by WHOLE WALL-CLOCK SECOND across the tubes
      │  when the second closes: sec_sum
      ▼
 ┌─────────────────────────────┐
 │ Trail::add(sec_sum)         │  analysis.rs
 │  ring of the last 33,536 s  │  the longest window and the rows on show
 └─────────────────────────────┘
      │
      │  once a second, when a snapshot is made:
      │  has a whole eight seconds gone by since the newest row?
      ├── no ──► the rows there were
      ▼
 ┌─────────────────────────────┐
 │ Trail::rows()               │  the 96 that end at the last whole
 │                             │  eight seconds and the 95 before
 │  a row that was kept: kept  │
 │  a row that is new:         │
 │    r, v of the 3000 s       │  the rate and the scatter before the
 │                             │  row's end
 │    for 32768, 4096, 512:    │  each window that has its seconds,
 │                             │  the longest first
 │      mean off · Hann        │  §II, steps 2 and 3
 │      |X|² of its bins       │  steps 4 and 5, §II.C
 │      ÷ (v · Σw²)            │  step 6
 │    joined, longest first    │
 └─────────────────────────────┘
      │  rows (shared, remade only when a row is due),
      │  the second the newest ends at · seconds since
      ▼
 Snapshot, once a second          the same message that carries the rest
      │
      ▼
 Chart::draw                      one canvas: dials, counts, spectrum, trail
      │  is (made, age, axis) what was drawn last time?
      ├── yes ──► the kept drawing, as it is
      └── no  ──► Chart::trail
                    loudest = the largest power on the paper
                    the ground, shaded
                    rows OLDEST FIRST, which is furthest away:
                       line  = the spectrum's floor − (index + age/8) × 2 px
                       x     = the spectrum's own axis, by period
                       y     = line − gain(power, loudest) × 24 px: up is more
                       ground painted back in under the trace
                       trace stroked by the thermal pen, as bright as
                         the row's level; a dot on each peak
                    a ring round the loudest peak on the paper
      then Chart::spectrum, over it: the front row, in the same pen
Three things about it are worth saying.
The rows are shared, not sent. A snapshot goes to the interface every second and the rows change every eighth, so they sit behind a reference count and are rebuilt only when a row is due.
The drawing is kept. The canvas is redrawn twelve times a second, because the needles on the dials move that often. The trail is some twenty-five thousand line segments and changes once a second, so it is drawn into a canvas::Cache that is cleared only when the newest row, its age or the axis changes. The software renderer the window uses in a virtual machine notices the difference.
A window that attaches late is not behind. The service replays what it holds, the feed gives every second of it to add, and the paper is full by the time the first live sample arrives.
IV. How much time it captures
The question has four answers, and they are different numbers. They are of the 512-second window, which is three quarters of the panel; the stretches to its left are after the table.
| What is meant | Arithmetic | Time |
|---|---|---|
| One row | W | 512 s = 8 m 32 s |
| The rows on the paper, foot to head | (D − 1) × H = 95 × 8 | 760 s = 12 m 40 s |
| … as the oldest leaves it | D × H = 96 × 8 | 768 s = 12 m 48 s |
| The counts in the picture | W + (D − 1) × H = 512 + 760 | 1272 s = 21 m 12 s |
| The counts behind the normaliser | 3000 | 50 m |
The row at the head of the paper was taken 12 minutes 40 seconds ago. But it was itself made from the 512 seconds before that, so the oldest count with any say in a trace arrived twenty-one minutes ago; and the level every trace is held against looks back fifty.
The long periods, on the left
| Stretch | Its window | A row is | Counts in the picture |
|---|---|---|---|
| 8 m 32 s to 1 h 8 m | 4096 s | 1 h 8 m 16 s | 4856 s = 1 h 21 m |
| 1 h 8 m to 9 h 6 m | 32768 s | 9 h 6 m 8 s | 33,528 s = 9 h 19 m |
So the whole picture, when every window has answered, is made from 9 hours 19 minutes of counts. But the rows there are not ninety-six looks at anything: see §V.D.
What that is worth
| Arithmetic | ||
|---|---|---|
| Windows that share no seconds | 1272 / 512 | 2.5 |
| Looks that are nearly independent, at half overlap | 760 / 256 + 1 | 4.0 |
| Counts in one row, at the bench's 0.9 a second | 0.9 × 512 | about 460 |
| Counts in the whole picture | 0.9 × 1272 | about 1150 |
| Until the first row, from a cold start | W | 8 m 32 s |
| Until the paper is full | W + (D − 1) × H | 21 m 12 s |
| Arithmetic | 388,608 steps every 8 s | — |
Ninety-six rows are therefore four measurements, not ninety-six. The other ninety-two are those four seen again as they slide past, which is what makes a ridge a line rather than four dots, and is also what §V is about.
The taper matters to the first figure. A Hann window weighs the middle of its 512 seconds fully and the two ends hardly at all, so a row answers mostly for the four minutes at its centre.
Against the spectrum it is drawn over
| Window | Reach | Keeps the time? | |
|---|---|---|---|
| Trail | 512 s | 21 m 12 s | yes, to 8 s |
| Spectrum, short | 512 s | everything since it started | no |
| Spectrum, middle | 4096 s | the same | no |
| Spectrum, long | 32768 s | the same | no |
V. Reading it
A. One spike means nothing
A single bin of a single periodogram of noise is an exponential variable, and the tallest of 269 stands about ln 269 above the mean. chance_max puts the line at 8.07 for one row. A trace is inked in the warning's colour from there up.
B. Nor does a short ridge
A row shares 504 of its 512 seconds with the row before. A spike that luck put in one is in its neighbours too, so chance draws ridges of its own. How long was measured, on simulated Poisson counts with nothing periodic in them, 400,000 seconds at each of two rates, with the rows held against the scatter of the long window as the window holds them:
| Rate | Runs over the line | Median | 90% within | 99% within | Longest |
|---|---|---|---|---|---|
| 0.45 counts/s | 390 | 10 rows | 19 rows | 27 rows | 31 rows |
| 0.90 counts/s | 333 | 10 rows | 18 rows | 23 rows | 31 rows |
And of papers of 96 rows, how many held a run that long in any bin:
| A run of at least | 16 rows | 32 rows | 48 rows |
|---|---|---|---|
| Share of papers, 0.45/s | 12% | none of 520 | none |
| Share of papers, 0.90/s | 11% | none of 520 | none |
So: a coloured streak under thirty-two rows -- half a window, a third of the paper -- is what noise looks like here. None of thirty-two was seen in 723 runs, and none that runs half the paper, 48 rows, in 800,000 seconds. Waterfall::chance_rows is the thirty-two. In seconds it is the same rule as at sixteen seconds a row: 256, half a window.
The first form, at 256 seconds and 8 with rows held against themselves, was measured the same way: the longest of 981 runs was 16, and a test holds that arrangement to it.
C. What it finds
A source with a period of 16 seconds was added to a background of 0.9 counts a second, 200,000 seconds at each strength:
| Source, as a share of background | Its bin reads | Rows over the line | Longest run in a paper, median |
|---|---|---|---|
| 50% | 13.5 | 85% | the whole paper |
| 20% | 3.6 | 6% | none |
| 10% | 1.8 | 1% | none |
This is the honest limit. The trail sees a period that is strong, and says when it was there. A faint one it does not see at all: at a fifth of background the bin reads 3.6 and the line is at 8.1. Finding the faint one is what averaging is for, and the spectrum above it does that; the two are not rivals.
D. The left of the paper is texture
A row of the 4096-second window shares 4088 of its seconds with the row before it, and one of the 32768-second window shares all but eight. Two rows are as good as independent when they are half a window apart, which is 256 rows for the first and 2048 for the second, and the paper holds 96.
So out there the traces are very nearly the same trace, ninety-six times, and they run up the paper as parallel lines: whatever one row reads, they all read. A coloured streak on the left that runs the whole paper is one draw of chance and not ninety-six, and the thirty-two-row rule is no use to it. What is to be believed about a long period is the averaged spectrum, where a window has been taken many times. The trail says how that bin is moving, slowly, and no more.
VI. The drawing
There is a ground, a line for each row, a height, a pen and an order.
The ground is shaded, the panel's own colour half way to black, from under the dials to the spectrum's axis and the full width. It is over the counts, where for an afternoon it was under them. On paper a pen can only be darker than its ground, and the loudest thing drawn was the least like light. Against a shaded ground a bright line is bright, and what is faint falls back into it.
Up is more. A trace rises from its line for what is louder, as a bar of the spectrum does and as every other chart on the panel does. For an afternoon the spectrum hung from the floor of the counts and the traces hung under it; a peak that points at the floor is read as a dip, and they were turned the right way up.
Where a row is. The spectrum is drawn on the foot of the ground, and the newest row is on the line it is drawn on, next to the counts it was made from. Each older one is 2 pixels further up the paper. A row's place is (index + age/8) × 2 above that line, where age is the seconds since the newest row, so the paper moves up a quarter of a pixel each second and the new row arrives into the gap it has made. Nothing is copied to make it move: a row's place is its index.
It came down the paper for an afternoon, newest at the head. Then the row that mattered most was the one furthest from the counts and behind every other.
Across is the period, on the spectrum's axis and by the spectrum's arithmetic: stretches cuts the axis and place puts a period on it, for both. A line in the spectrum therefore has its ridge straight up the paper over it. The axis grows as the spectrum's longer windows answer -- 8 minutes, then 1 hour 8, then 9 hours 6 -- and the trail grows with it, the full width each time.
The left of the axis is compressed. An axis that gave every doubling of the period the same width gave the periods over a row's length the left two fifths of the panel, and fourteen bins to put there, while the right-hand fifth held a hundred. So it is cut where the windows are, as the counts' strip is cut into tiers, and each stretch is a logarithm of its own:
| Stretch | Width | Bins of a row in it |
|---|---|---|
| 9 h 6 m to 1 h 8 m | 10% | 7 |
| 1 h 8 m to 8 m 32 s | 14% | 7 |
| 8 m 32 s down to where the axis ends | 76% | up to 255 |
While the 512-second window is the longest to have answered, the axis is that one stretch. Under the ground each stretch has a caption at its left, which is the period it begins at.
How far a trace rises is analysis::gain:
height = ln(1 + power) / ln(1 + loudest) from nought to onetimes 24 pixels, twelve rows. loudest is the largest power on the paper, and never less than the luck line, so the scale adjusts itself. That is a logarithm and an automatic gain together, and each does a different thing. The logarithm is nought at nought and nearly the power itself while the power is small, so the floor of noise is drawn as it is; above that every doubling is the same step, so something forty times the mean is two and a half times as tall as something three times it, and not thirteen. The automatic top means the tallest thing on the paper is as tall as there is room for, whatever it is.
| Power | Drawn, with 40 the loudest | In proportion it would be |
|---|---|---|
| 1.0, flat | 19% | 2.5% |
| 8.1, the luck line | 59% | 20% |
| 40 | 100% | 100% |
Nothing is off the chart. Whatever is loudest is the top, so there is no figure a signal can pass and be cut off at. With something of 2000 on the paper:
| Power | Drawn, with 2000 the loudest | In pixels | In proportion it would be |
|---|---|---|---|
| 1.0, flat | 9% | 2.2 | 0.05% |
| 8.1, the luck line | 29% | 7.0 | 0.4% |
| 2000 | 100% | 24 | 100% |
The floor has given up half its height to make room and can still be seen, and when the loud thing has gone up the paper and off it, the scale is what is left. A test holds gain to those figures.
The spectrum's bars are drawn by the same function, against the loudest bar in view. Before, they were drawn in proportion, and the longest periods -- which hold the room's slow drift and every tube that stopped and started -- left everything else a pixel high.
The pen is a thermal one, and says how loud in three ways at once. Each stretch of a trace is drawn for the louder of its two ends, in one of sixty-four shades; which shade is gain(power, 1.5 × luck), a logarithm again, so that the shades are spent where the powers are.
| Power | Colour | Width |
|---|---|---|
| nothing | teal, hardly there | 0.6 px |
| 1.0, flat | sea green | 1.1 px |
| 2 to 5 | green to lime | 1.5 to 1.9 px |
| 8.1, the luck line | yellow going orange | 2.2 px |
| over it | orange to red | 2.3 px |
| 12.1 and over | white, by way of pink | 2.4 px |
Its colour is a temperature, and most of it is green. Most of what is drawn is the floor, and the eye tells more greens apart than it does any other colour: seven tenths of the run goes from teal through green to lime, for the part of the paper where the detail is. Then it is hot -- yellow just under the line luck reaches, orange and red over it, which no floor ever is, and white for what is half as much again as luck could do. It is one gradient: between any two of those it is a mixture, and a test holds every step from one shade to the next under an eighth of the way in any channel. Sixteen shades were bands, at the hot end above all, where yellow, orange, red and white were four steps apart.
Its width grows with the same figure, from half a pixel to two and a half.
And over the luck line it glows: a stroke three pixels wider, of the same colour at a fifth of the opacity, under the line itself.
All three are measured against the luck line and not against the loudest in view. So the height of a trace is relative to the paper it is on, and its colour and width are not: yellow is the luck line on every paper.
The whole trace is as bright as the room counted. A row has a level: what was counted in its own 512 seconds, against the long average. It is 1.0 when the room is as it has been. The trace's opacity is 0.30 + 0.70 × gain(level, busiest), where busiest is the highest level on the paper and never less than 2:
| Level | The room was counting | Opacity |
|---|---|---|
| 0.5 | half its usual | 56% |
| 1.0 | its usual | 74% |
| 2.0 and the most on the paper | twice it | 100% |
So the paper says when the rate rose as well as what it rose at. A test raises a room from 0.9 counts a second to 27 for five minutes: the row stands at 7.7 -- not 30, because the five minutes are a tenth of the long average, and are only part of a row -- and every bin of it is up with it, so the whole trace is hot, wide and at full brightness. Over the next fifty minutes the average catches up and the rows come back to 1.0.
A peak is marked. Where a row stands over both its neighbours and over the luck line it has a dot, in the pen's colour. The one loudest of them on the whole paper has a ring round it, which is the only pure white there is. TrailRow::peaks finds them, and a level top is one peak and not two.
The order is the painter's, and in front is newer and further down. A trace rises over the lines above its own, so the oldest row is drawn first and every newer one over it; under each trace the ground is painted back in, from the trace down to the row's own line, so a row hides what is behind it and the lines do not run through each other. The newest row is in front and at the whole of its brightness, and a row fades to two thirds of it as it goes up the paper and away.
The spectrum is the front row. It is drawn last and over everything, on the foot of the ground, as one trace joined from the windows exactly as a row is -- every bin of the shortest, and of each longer one only the bins beyond the window before -- with a point for each bin at the place axis gives its period and the height gain gives its power against the paper's own top, from the line the newest row is on, and by the same pen keyed to the same luck line. So the same power is the same colour and the same width in it as in any row, and a peak in it and the same peak in the row above are the same pixel across. It was three lines in the three windows' inks, through bins folded to whole pixels and drawn half a pixel over, to a scale of its own; none of that could be matched to the rows by eye, and the rows are what it is for. What it gave up is the extra bins the longer windows have inside the shorter one's range.
There are no words in it. The axis under the ground is the spectrum's and serves both.
VII. What the bench showed
A. A bright patch that was noise
The first picture taken of the first form had a bright patch near the 2-second end. It was measured rather than believed: a program attached to the service, took the 6168 seconds it replayed, and ran the last 1024 through Waterfall three ways, at 256 seconds and 8.
| Input | Bins over the line in 3 rows or more |
|---|---|
| The two tubes summed | one: period 2.72 s, 8 rows running, tallest 8.0 |
| Tube A alone | none |
| Tube B alone | none |
Eight rows is inside what chance draws, and a period that belonged to the room would be in each tube as well as in their sum. It is noise, and it is the example of why §V.B was measured.
The same run found something that is not noise and is not a period. In those 6168 seconds, one tube delivered two samples inside a single wall-clock second 41 times and the other 13 times -- a counter's second and the machine's are not the same second, and now and then two of the first land in one of the second. Each of those is a second that reads double with a second beside it that reads nothing. They are rare and not regular, so they raise the floor a little and draw no line.
B. The second tube counts in clumps
The rows went hot from one side of the paper to the other, at 20:30 on the same day, with no period in them and the room at its usual 40 CPM. The counts were taken per tube from the service's replay, in blocks of 512 seconds:
| Block, ago | Tube A mean | Tube A variance | Tube B mean | Tube B variance |
|---|---|---|---|---|
| 0 s | 0.285 | 0.301 | 1.391 | 5.875 |
| 512 s | 0.250 | 0.250 | 1.715 | 9.708 |
| 1024 s | 0.246 | 0.256 | 0.684 | 1.072 |
| 2560 s | 0.252 | 0.263 | 0.738 | 1.420 |
| 3072 s | 0.279 | 0.268 | 1.404 | 9.088 |
| 5120 s | 0.227 | 0.226 | 0.670 | 1.131 |
Tube A is Poisson: its variance is its mean, block after block. Tube B is not. Its variance runs at nearly twice its mean at the best of times, and in three of those blocks at six times it: its counts come in clumps. Against a normaliser that was the mean, every row of a clumped tube stood at twice flat, and the clumped quarter hours at six times, in every bin at once -- which is what was on the paper.
That is what §II.B's scatter is for. Against it a clumped tube reads flat, and a burst of clumps reads as a burst: a whole row up, side to side, with no streak in it. What tube B is doing is a question for the bench and not for this report; that the paper showed it is the report's point.
VIII. Examples
All four are of the bench on 29 September 2026, two GMC-320 counters in a room at background, in a window 626 pixels wide beside another.
A. The panel
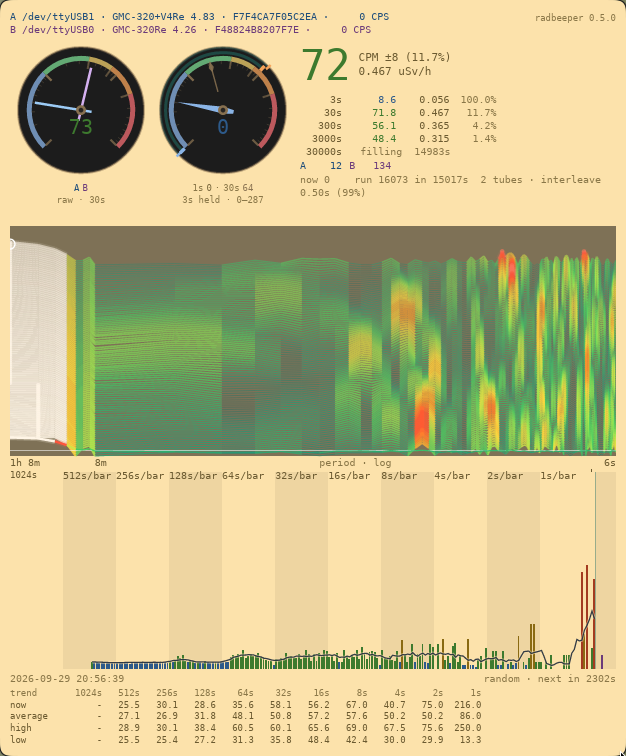
Top to bottom: who is on the other end, with each tube's newest second; the dials and the averages; the drum spectrogram on its shaded ground, with the spectrum as its front row; the one axis both are drawn on, where 1h 8m and 8m are where its stretches begin and 6s is where it ends; and the counts, compressing as they age, with the trend line over them.
B. The drum spectrogram
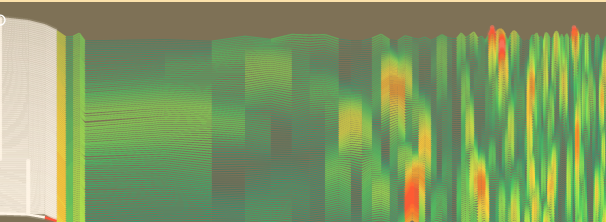
Ninety-six rows. The newest is at the foot, on the line the spectrum's own trace is drawn on, and the oldest at the head. Nearly all of it is green, which is the floor of noise: nothing in this room is arriving on a schedule. The left seventh is the stretch from an hour to eight and a half minutes, where a row has seven bins and the traces are nearly the same trace (§V.D). The patches of yellow and orange are where a bin stood over the luck line for some rows running.
C. A peak, and the loudest on the paper
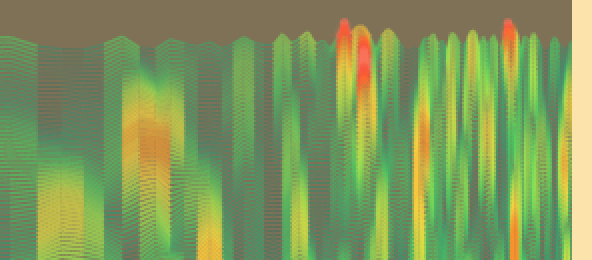
Twice life size. The pen is wider where it is hotter, and glows over the luck line. The hottest column of the picture it was cut from has one hot patch in it, of 38 pixels: nineteen rows of two pixels, under the thirty-two that chance draws (§V.B). It is what noise looks like, and is here as the example of a thing that looks like a finding and is not one.
D. The pointer over the counts
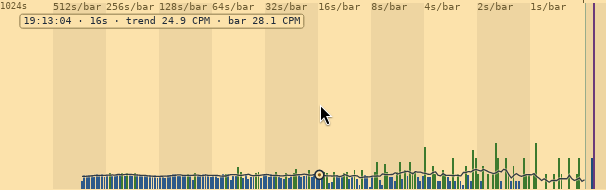
A circle on the trend line at the bar the pointer is over, a hair from it down to the floor, and the words: the bar began at 19:13:04, is sixteen seconds long, the trend there reads 24.9 CPM and the bar itself 28.1.
IX. Naming
A drum spectrogram. A spectrogram is what it is: power against period, row by row in time. The drum is the recorder it is drawn after -- the seismograph's, whose pen writes a line round a turning drum and moves along it, so that an hour is a page of lines one over another and an earthquake is a shape that runs across them.
It is not a waterfall, though it was filed under that name for an afternoon. A waterfall colours a cell for each row and each frequency, and its rows have no height; here a row is a trace with a height, which is what lets a peak be seen as a peak. It is not quite a ridgeline plot either, which stacks distributions and has no time in it.
Its parts have names of their own, which are the names in the code:
| Name | What it is | Where |
|---|---|---|
| trail | the rows on the paper | analysis::Trail, Chart::trail |
| reach | one window of a row, and the bins it is asked for | Reach |
| stretch | one cut of the period axis | stretches, place |
| thermal pen | colour, width and glow by power | heat, pen, shade_of |
| level | what a row's room counted, against the long average | TrailRow::level |
| gain | a height by its logarithm, against the loudest in view | analysis::gain |
The mechanism, in one line: joined-window periodograms, held against a long window's scatter, drawn as a rising stack of traces by a thermal pen on a logarithmic scale that sets its own top.
X. What was built first, and replaced
The first form, of the same afternoon, was a glass box on a dark ground seen in perspective, after the screensaver of SETI@home [3]: period across in the colours of the rainbow, power as spikes standing on a floor, time running back, a title and an axis of its own, and a camera fixed by three constants. It is in the history at d3b1cfd.
| The box | The trail | Why it changed |
|---|---|---|
| A display of its own, under the spectrum | The spectrum, going away | it was the same measurement, drawn as though it were another |
| Its own axis, 256 s to 2 s | The spectrum's axis | a period was in two places on one panel |
| A dark ground of its own, in a frame | The panel's ground, shaded | it was a hole in the paper; the shade is the paper, darker |
| A title, a luck figure, two axis labels | No words | the axis is already under the panel |
| Colour by period | Colour, width and glow by power | where a spike is, its place already says |
| Spikes standing up | Traces rising, after an afternoon of hanging | up is more |
| 48 rows, 4 px apart, every 16 s | 96 rows, 2 px apart, every 8 s | twice the resolution in time, the same paper |
| Sixteen shades | Sixty-four, one gradient | the hot end was bands |
| The spectrum in its own inks, to its own scale | The front row, in the pen, to the rows' scale | it could not be matched to the rows |
| Rows against the long mean | Against the long scatter | a tube that counts in clumps read hot everywhere |
| Under the counts, newest row at the head | Over the counts, newest row at the foot | the newest row is next to the counts it was made from, and in front |
| Height in proportion, cut off at 12 | Logarithm, against the loudest in view | detail, whatever is loudest |
| Divided by the row's own mean | By the 3000-second average | rows that can be compared |
| 256 s a row, every 8 s | 512 s a row, every 16 s | the spectrum's own window, on its own grid; 300 and 10 for an afternoon between |
And of the trail's own first hours: its rows were of one window alone and began two fifths of the way across, on an axis of one logarithm. They are joined from four windows now and the axis is in stretches (§II.C, §VI), because the paper was to be the full width. Its pen was the panel's own inks on the panel's own ground, ten shades in proportion to the power; it is the thermal pen now, on a shaded ground, because on paper the loudest thing was the darkest.
XI. Limitations
- The long periods are coarse, and slow. Fourteen bins cover everything from eight and a half minutes to nine hours, and their rows hardly differ from one to the next (§V.D). The 32768-second window has no row until the window has been given nine hours of seconds.
- It is the sum of the tubes. When a tube stops answering, the rate halves. The mean is removed from each row, but a step inside a window is not a mean, and it puts power into the long-period end until the step has left the window, eight and a half minutes later. The long scatter takes fifty minutes to forget it.
- Faint periods are invisible to it, by §V.C.
- Heights on two papers are not the same heights. The top of the scale is the loudest thing in view, so a trace that rises six rows on a quiet paper rises three beside something loud. The colours and the widths do not move.
- A raised rate and a period are both hot. A row from a room counting eight times its usual is over the luck line in every bin, by chance alone, and is drawn as hot as a period would be. What tells them apart is the shape: a raised rate is a whole trace, from one side of the paper to the other, and a period is a streak down it.
- The window only.
radbeeper watchin a terminal has no trail; a character cell is too coarse for it. - It is drawn in a window 640 high or more. Under that the counts and the spectrum keep the panel.
XII. Where it is
src/analysis.rs | Trail, which the window uses; Waterfall and Waterfall::leveled, one window of it, which the measurements were made with; TrailRow and its peaks; scatter_of, powers, gain, chance_max_of; and thirteen tests, the thirteenth a clumped tube reading flat and a burst high, and: a ridge in every row, no ridge in noise, how long luck's ridges run, nothing before a window, a window of any length, a row against the long average, a height by its logarithm, a height adjusting itself, a row as far as its longest window, the short end of that row being the waterfall's, a row as high as the room counted, and a peak over its neighbours |
gui/src/main.rs | FALL_*, TRAIL_* and STRETCH_* constants, regions, stretches, place, shade_of, heat, pen, shaded, Chart::axis, Chart::trail, Chart::spectrum |
| Root crate's dependencies | unchanged: libc |
References
[1] P. D. Welch, "The use of fast Fourier transform for the estimation of power spectra: a method based on time averaging over short, modified periodograms," IEEE Trans. Audio Electroacoust., vol. AU-15, no. 2, pp. 70–73, 1967.
[2] F. J. Harris, "On the use of windows for harmonic analysis with the discrete Fourier transform," Proc. IEEE, vol. 66, no. 1, pp. 51–83, 1978.
[3] D. P. Anderson, J. Cobb, E. Korpela, M. Lebofsky and D. Werthimer, "SETI@home: an experiment in public-resource computing," Commun. ACM, vol. 45, no. 11, pp. 56–61, 2002.