The table
← The random line · ↑ Reading the window
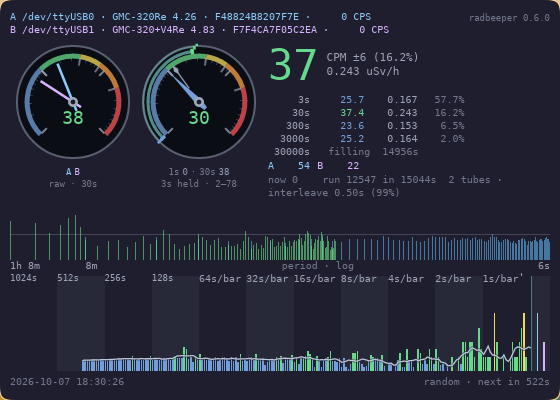
The bottom of the window: the trend line in numbers.
trend   1024s   512s   256s   128s   64s   32s   16s    8s    4s    2s    1s
now         -      -      -      -     -  28.7  25.4  21.0  26.8  33.9  24.0
average     -      -      -      -     -  36.7  25.6  22.5  33.9  28.4  29.2
high        -      -      -      -     -  44.9  28.1  27.3  47.5  37.6  60.0
low         -      -      -      -     -  28.7  23.6  18.8  20.3  16.3  10.0
One column per panel of the counts, in CPM. now is where the trend line is at the newest bar of that panel; average is its mean over the whole panel; high and low are its extremes there. A dash is a panel that has not filled yet.
It is the same information as the strip, for reading off rather than looking at: the table is what to quote, the strip is what to watch.
In a small window the table comes first. The window fits whatever space it is given; as it runs out of height the drum goes first, then the counts, and the table stays. The window follows the desktop's light or dark theme.